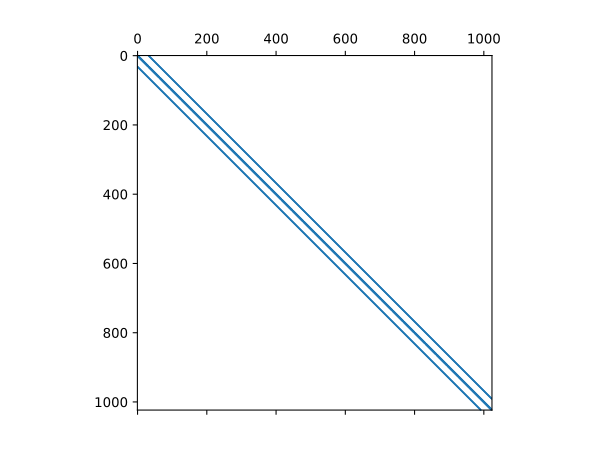
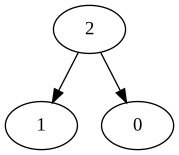
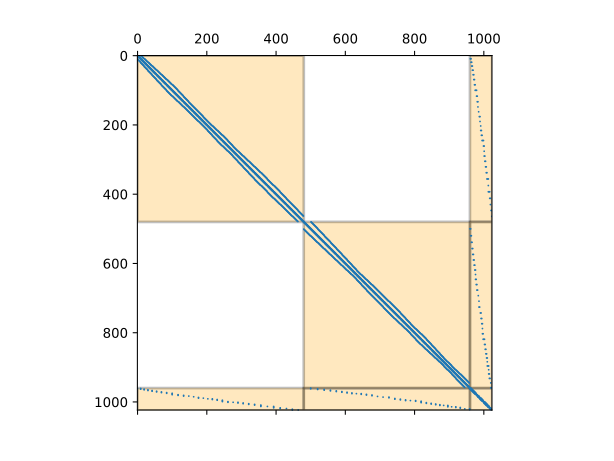
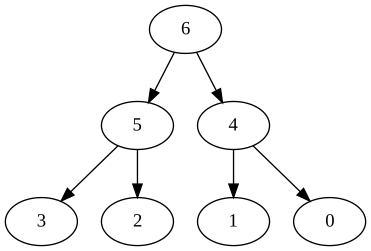
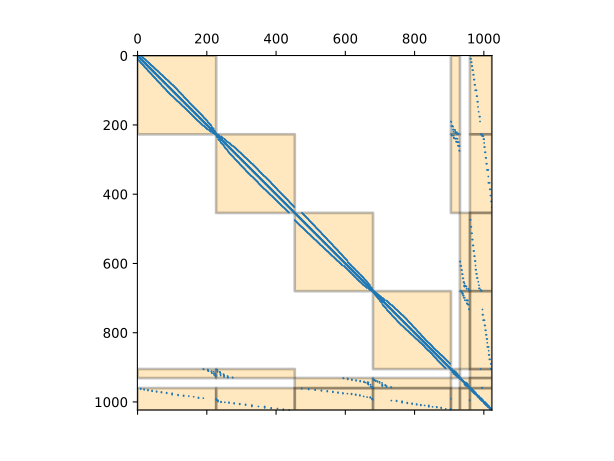
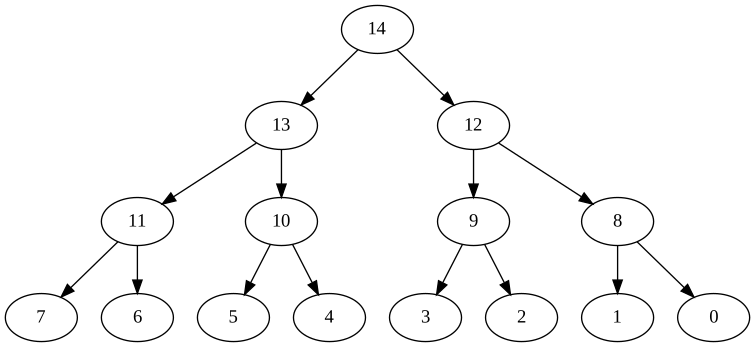
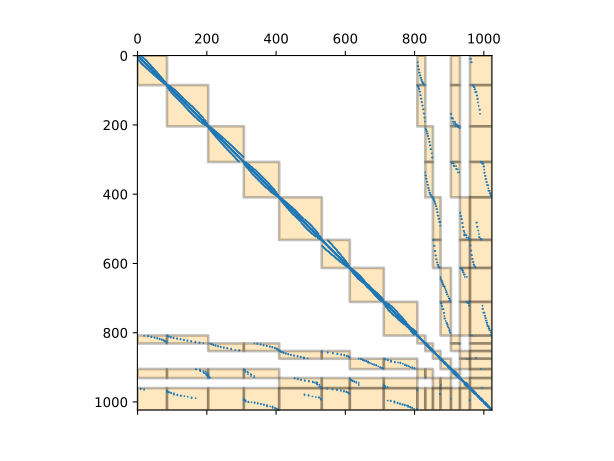
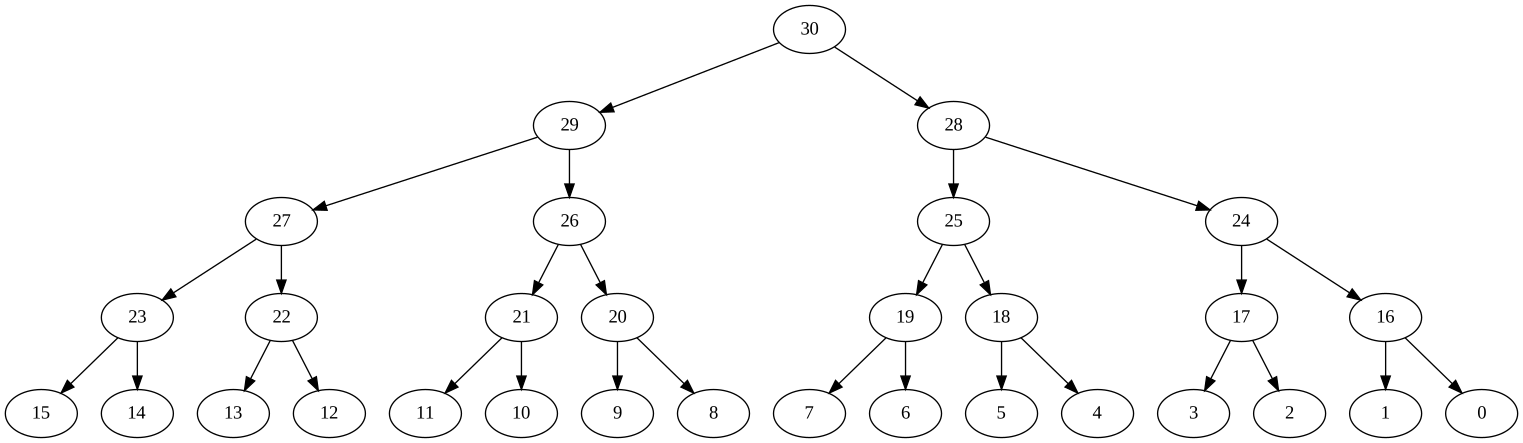
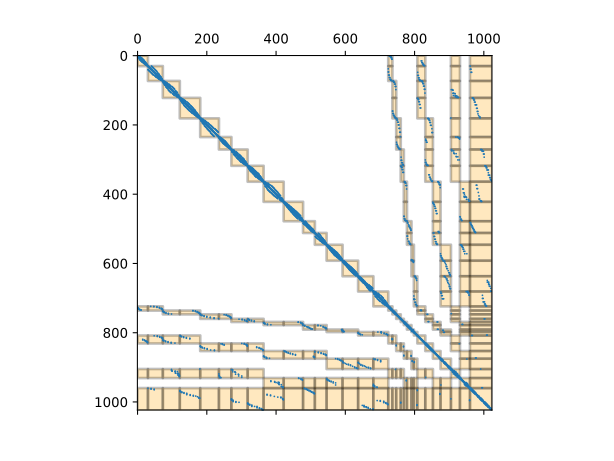
Sparse direct solvers involve a lot of graph theory on top of numerical linear algebra. The addition of graph theory can make it very challenging to build intuition. To help build my intuition for how things work I built a sequence of visualizations for different steps of nested dissection, a very useful matrix reordering strategy that reduces fill-in for factorizations. Nested dissection builds in a nested block structure where all potential fill-in from a factorization algorithm gets confined to the blocks and no fill-in can occur outside of the blocks. The “nested” part of nested dissection also produces a tree structure that helps for producing a parallel algorithm. I visualize both the tree structure and block structure here. I take a 2D Laplacian matrix and do 5 levels of nested dissection, visualizing each level.
I visualize these together first
| Dissection Level | Tree Diagram | Block Structure |
|---|---|---|
| 0 | Base case | |
| 1 | | |
| 2 | | |
| 3 | | |
| 4 | | |
Since the tree diagrams start to take a lot of space I also visualize both the trees and blocks separately below
Next I visualize the tree structure alone - to give the images more space
| Dissection Level | Tree Diagram |
|---|---|
| 0 | Base case |
| 1 | |
| 2 | |
| 3 | |
| 4 | |
Similarly I visualize the block structure alone - to give the images more space
| Dissection Level | Block Structure |
|---|---|
| 0 | |
| 1 | |
| 2 | |
| 3 | |
| 4 | |