I explore how very small ML models might in some cases be better trained on CPU compared to GPU. I use the recent AdderBoard as a source for models and inspiration. In one of these I was able to achieve an ~8x per-iteration speedup on my laptop (CPU, custom C++) compared to a PyTorch A100 training run.
These are very small transformer models designed to reliably compute integer addition. I suspected these models were small enough that framework and launch overheads might dominate on GPU (for the training version of this competition). So I picked the current-best trained adder, followed the instructions to reproduce training, and built an optimized version of the same training loop.
What I found: the speedup is primarily from removing a lot of framework/dispatch/allocation overhead on the CPU side and avoiding GPU kernel-launch overhead for tiny kernels. Cache residency and parallelism are also contributors. You can sometimes see apparent superlinear speedup when the per-thread working set moves into faster caches (for CPU: private L1/L2, shared L3), but that is not the only mechanism here.
The code for my C++ implementation of the training lives in this repository.
Per-iteration timing in this post is intended to cover:
Excluded from per-iteration timing:
Warmup / startup handling:
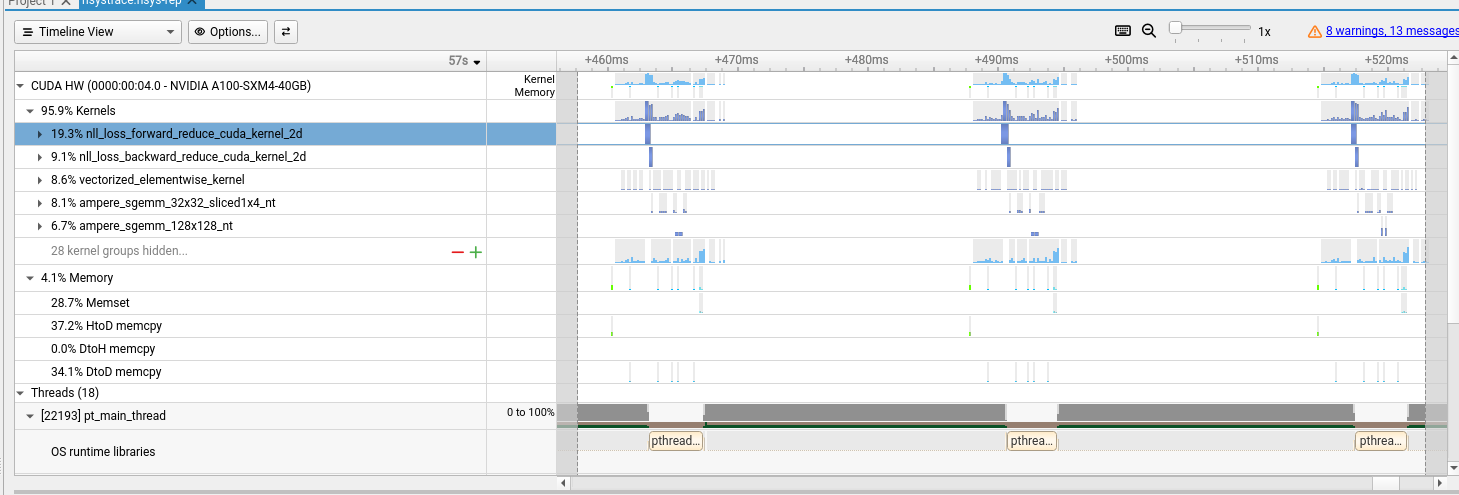
Excl. Startup Time and Excl. Startup ItersI spun up a GCP A100 instance and followed the README to run training from scratch. I also traced execution to understand overhead and utilization.
Since the model is so small there is significant kernel-launch overhead, seen as gaps between meaningful compute on the trace.
Omitting traced results, per-iteration latency is about 20ms.
| Configuration | Total Time (s) | Total Iters | Excl. Startup Time (s) | Excl. Startup Iters | Per Iteration (ms) |
|---|---|---|---|---|---|
| 1. GPU Baseline | 20.7s | 1,000 | 20.1s | 999 | ~20.1 ms |
Given the launch overhead, I looked for a quick win with CUDA Graphs. CUDA Graphs record a sequence of launches and replay them, which often reduces launch/dispatch overhead for fixed-shape workloads. It helps here, but not dramatically.
| Configuration | Total Time (s) | Total Iters | Excl. Startup Time (s) | Excl. Startup Iters | Per Iteration (ms) |
|---|---|---|---|---|---|
| 1. GPU Baseline | 20.7s | 1,000 | 20.1s | 999 | ~20.1 ms |
| 2. GPU torch.compile | 26.0s | 1,000 | 19.2s | 999 | ~19.2 ms |
| 3. GPU compile + CUDA Graphs | 24.8s | 1,000 | 17.9s | 999 | ~17.9 ms |
Interpretation: total wall time can get worse while steady-state per-iteration improves, because torch.compile adds upfront compilation overhead.
If you care about time-to-first-1000-steps, baseline can still win. If you care about long steady-state runs, compile/graphs can win.
As alluded to earlier, I suspected this model was tiny enough that GPU overhead (kernel launch and framework plumbing) could offset raw hardware advantage for this specific workload. I also ran PyTorch on CPU as a rough sanity check.
Environment details for CPU sanity check:
torch.get_num_threads(), OMP_NUM_THREADS, MKL_NUM_THREADS, and BLAS backend were not capturedThe GPU beats untuned PyTorch CPU on that system, but this model is so small that it should fit in cache, so a specialized C++ implementation can push overhead down a lot. I asked Codex to write a single-file C++ training loop with model-size limits hardcoded as constexpr, which gives the compiler room for aggressive optimization (unrolling/vectorization).
This performed surprisingly well on my laptop. I also parallelized with OpenMP. For this problem size, parallelism plus cache effects can produce apparent superlinear behavior when the working set per thread drops into faster cache levels.
Raw text for the exact compile + run commands used:
CXXFLAGS="-Ofast -march=native -mtune=native -flto -ffast-math -funroll-loops -fopenmp-simd -fstrict-aliasing -fno-trapping-math -fno-math-errno -falign-functions=32 -falign-loops=32" make
./train_311p --steps 500000 --lr 0.02 --lr-stages 162000:0.001,262000:0.0003,312000:0.0001,400000:0.00005
| Configuration | Total Time (s) | Total Iters | Excl. Startup Time (s) | Excl. Startup Iters | Per Iteration (ms) |
|---|---|---|---|---|---|
| 0. Inlined C++ Training | – | – | – | – | ~2.2 ms |
| 1. GPU Baseline | 20.7s | 1,000 | 20.1s | 999 | ~20.1 ms |
| 2. GPU torch.compile | 26.0s | 1,000 | 19.2s | 999 | ~19.2 ms |
| 3. GPU compile + CUDA Graphs | 24.8s | 1,000 | 17.9s | 999 | ~17.9 ms |
| 4. PyTorch CPU eager (not tuned, sanity check) | 31.8s | 20 | 0.9s | 19 | ~47.0 ms |
What I held constant (to the extent reproduced from the training script):
What I did not fully control (or did not record well enough):
MKL/oneDNN/OpenMP runtime behavior)This comparison is not apples-to-apples hardware benchmarking (PyTorch on A100 vs hand-written C++ on a laptop). I still think it is useful as a case study: for tiny models, overheads can dominate enough that a specialized CPU implementation wins on per-iteration latency.
GPU cache note: GPUs do have cache hierarchy, but it is different from CPU cache behavior (e.g., per-SM L1/shared memory plus a shared L2). So I am not claiming a 1:1 cache analogy. A realistic GPU path here is likely better operator fusion / fewer launches (and possibly graph capture), not assuming one giant shared-memory “megakernel” is always practical.
During training I withhold 10 sums and validate against them. I observe the same “Grokking” behavior the original author achieved.
| # | Operand A | Operand B | Actual Sum | 100k (Rel. Error) | 300k (Rel. Error) | 500k (Rel. Error) |
|---|---|---|---|---|---|---|
| [0] | 314,159,265 | 271,828,182 | 585,987,447 | 11.30% | 2.73% | 0.00% |
| [1] | 987,654,321 | 123,456,789 | 1,111,111,110 | 1.00% | 1.01% | 0.00% |
| [2] | 555,555,555 | 444,444,445 | 1,000,000,000 | 2.22% | 10.00% | 0.00% |
| [3] | 808,080,808 | 90,909,090 | 898,989,898 | 13.71% | 0.10% | 0.00% |
| [4] | 246,813,579 | 135,792,468 | 382,606,047 | 7.74% | 3.30% | 0.00% |
| [5] | 112,233,445 | 556,677,889 | 668,911,334 | 12.45% | 1.66% | 0.00% |
| [6] | 99,999,999 | 12,345,678 | 112,345,677 | 9.01% | 2.09% | 0.00% |
| [7] | 420,420,420 | 133,713,371 | 554,133,791 | 0.35% | 2.85% | 0.00% |
| AVG | 7.22% | 2.97% | 0.00% |
When a problem is this small, overhead terms can dominate and move the result in unintuitive ways. In this case, removing framework/dispatch/allocation overhead and avoiding frequent tiny GPU launches produced most of the observed gain, with cache residency and parallelism helping further.
So yes, apparent superlinear effects can show up when the working set moves into faster caches, but that should be treated as one contributor rather than the sole explanation.
I still think there is room to recover more GPU performance here with better fusion and fewer launches; a monolithic training megakernel is one extreme, but not the only path.